This site is the archived OWASP Foundation Wiki and is no longer accepting Account Requests.
To view the new OWASP Foundation website, please visit https://owasp.org
Difference between revisions of "Application Security Guide For CISOs"
Marco-cincy (talk | contribs) |
Marco-cincy (talk | contribs) |
||
| Line 73: | Line 73: | ||
It is important to notice that SQL injection exploits herein is being referenced as an example of a top 1 OWASP (Ref [5]) (2010 A1-Injection) most critical web application security risks for opportunistic exploits. OWASP rates SQL injection vulnerability technical impact as severe since "can result in data loss or corruption, lack of accountability, or denial of access and..sometimes lead to complete host takeover". The business impact that we calculated as liability for a medium size company based upon a value of the asset of 655 $/user assumes that this value can be stolen, modified or deleted to cause both tangible harm to the company (e.g. money loss) as well as intangible harm (e.g. reputaton damage). | It is important to notice that SQL injection exploits herein is being referenced as an example of a top 1 OWASP (Ref [5]) (2010 A1-Injection) most critical web application security risks for opportunistic exploits. OWASP rates SQL injection vulnerability technical impact as severe since "can result in data loss or corruption, lack of accountability, or denial of access and..sometimes lead to complete host takeover". The business impact that we calculated as liability for a medium size company based upon a value of the asset of 655 $/user assumes that this value can be stolen, modified or deleted to cause both tangible harm to the company (e.g. money loss) as well as intangible harm (e.g. reputaton damage). | ||
| − | Besides calculation of liability costs, quantitative risk analysis can be used to estimate the spending for application security measures on the yearly basis such as by calculating the impact of a security incident on an annual basis. Quantitative risks can be calculated by the assessment of the Single Loss Expectancy (SLE) or probability of a loss as a result of a security incident and the Annual Rate of Occurrence (ARO) or the annual frequency of the security incident. By using quantitative risk analysis, CISOs can estimate the amount that a given organization managing a web application should spend on application security measures to mitigate the risk of a data loss due to the exploitation of an application vulnerability | + | Besides calculation of liability costs, quantitative risk analysis can be used to estimate the spending for application security measures on the yearly basis such as by calculating the impact of a security incident on an annual basis. Quantitative risks can be calculated by the assessment of the Single Loss Expectancy (SLE) or probability of a loss as a result of a security incident and the Annual Rate of Occurrence (ARO) or the annual frequency of the security incident. By using quantitative risk analysis, CISOs can estimate the amount that a given organization managing a web application should spend on application security measures to mitigate the risk of a data loss due to the exploitation of an application vulnerability. |
The SLE can be calculated with the following formula: | The SLE can be calculated with the following formula: | ||
| Line 87: | Line 87: | ||
The calculated Annual Loss Expectancy (ALE) for data loss incident is therefore $ 6,026,000/year | The calculated Annual Loss Expectancy (ALE) for data loss incident is therefore $ 6,026,000/year | ||
| + | [Add here comparison with average cost of incident to company from Ponemon institure/Arcsight survey] | ||
| + | [Add here that TJX Incident was caused by SQL injection attack] | ||
| + | [Add here that Verizon study points to at least 50 % of attacks were the result of hacking and that high profile breaches including PBS, Sony Epsilon were result of web application attacks] | ||
Now the question is if using quantitative risk analysis leads to an estimate to the optimal investment for application security measures. The honest answer is, not necessarily. The correct answer is to use cost vs. benefit analysis to determine the optimal value. By comparing the costs of security incidents against the cost of security measures it is possible to determine when this maximizes the benefit, that is, the overall security of the application. In case of software security costs for example, the cost due to software security failures including security incidents decrease as the company spends more money in security measures as shown in (FIG 1). The optimal investment in the security measures is the one that maximizes the security of the application and minimizes both the cost of security measures and of the cost incurred because of security incidents. According to an analytical study of costs vs. benefits of security (Ref [12]) the optimal investment is when the cost of security measures is approximately 37% of the estimated losses. For our example, assuming the total estimated losses of $ 6,026,000/year due to data loss incidents, the optimal expense for security measures, using this empirical value from the study, is $ 2,229,620/year. | Now the question is if using quantitative risk analysis leads to an estimate to the optimal investment for application security measures. The honest answer is, not necessarily. The correct answer is to use cost vs. benefit analysis to determine the optimal value. By comparing the costs of security incidents against the cost of security measures it is possible to determine when this maximizes the benefit, that is, the overall security of the application. In case of software security costs for example, the cost due to software security failures including security incidents decrease as the company spends more money in security measures as shown in (FIG 1). The optimal investment in the security measures is the one that maximizes the security of the application and minimizes both the cost of security measures and of the cost incurred because of security incidents. According to an analytical study of costs vs. benefits of security (Ref [12]) the optimal investment is when the cost of security measures is approximately 37% of the estimated losses. For our example, assuming the total estimated losses of $ 6,026,000/year due to data loss incidents, the optimal expense for security measures, using this empirical value from the study, is $ 2,229,620/year. | ||
Revision as of 15:05, 14 August 2011
This article is a work in progress toward the project's overall goal to...
Document Application Security Guide For CISOs
Here is the current draft of part I
Part I: Business cases and risk-cost criteria for application security spending
In the digital era, global organisations serve an increasing number of customers through web online and mobile applications. These are feature-rich applications allowing customers to open accounts, pay bills, apply for loans, book resources and services, transfer funds, view account information, download statements etc. This online experience is convenient for customers: it allows them to perform the same transactions as being at the vendors branch/office/outlet but with the added convenience of conducting transactions remotely from their home PC or their mobile phone.
At the same time, this convenience comes at a price for online vendors, since online commerce sites become the target of an increased number of attacks from hacking and malware. The goal of these attacks is the unauthorized acquisition of sensitive data that includes passwords, account data, credit and ATM cards data and last but not least, alteration of on-line financial transactions such as transfers of money to commit fraud. Verizon’s 2011 data breach investigations report (Ref [1]) names hacking and malware as the most prominent types of attacks, yielding stolen passwords and credentials and thus posing a major threat to any instutions whom trades online.
To cope with this increase in hacking and malware attacks, Chief Information Security Officers (CISOs) are called to roll out security measures to mitigate the risks and investments in application security an even larger portion of the overall information security and information technology budgets. Nevertheless, making the business case for increasing the budget on application security today still represents some challenges especially when competing with the same budget allocated for application development of new features for the company sites that could retain and attract new customers as well as expand the profitability of the company. Moreover, in today’s recession economy and in a scenario of slow growth in business investments including the company’s built-in software (Ref [2]), it is increasingly important for CISOs to articulate the "case" for investment in application and software security.
Typically, application security budget allocation includes the development of new countermeasures at the application layer for mitigating risks of hacking and malware and limit the occurrence of future data breach incidents. This increased spending in risk mitigation measures add on to other security costs such as cost for governance to comply with industry specific security standards such as, in the case of the banking sector, the 2011 addendum to Federal Financial Institutions Examination Council (“FFIEC”) guidelines for online authentication (Ref [3]). CISOs can build a business case for application security budget today for different reasons, some directly tailored to the specific company risk culture or appetite for risk others, including using application security surveys (refer to OWASP CISO survey here TBD). Specifically, (based by the OWASP CISO survey) the most popular business cases for budget increase in application security spending today need to satisfy, at minimum, the following company needs:
- Mitigation of new hacking and malware threats targeting web sites and if already being data breached, implementation of countermeasures to prevents other similar data breaches-incidents to occur
- Meeting of new industry specific compliance requirements for web applications (e.g. FFIEC, PCI-DSS)
Nevertheless, assuming the business case is made with the points 1 and 2 herein, CISOs today still have the difficult task to justify “how much” money should the company spend for application security and “where” to spend it. .Regarding the how much is boils down to how much is needed to mitigate the risks or to reduce the residual risks to an acceptable value for the business. Both for real risks (e.g. incidents) and for compliance risks (e.g. unlawful non-compliance), the question for CISO is also what is the most efficient way to spend the application security budget today or which application security process, activity tools yields the company “more bang for the money”. Regarding the "where" it comes down to budget properly different application security and risk domains, to name the most important ones: governance, risk management, identity management and access control, network security and infrastructure, detection and incident management and last but not least the security of applications and software development projects. Since as discipline application security encompasses all these domains, it is important to consider all of them and look at the application security investment from different perspectives.
From the perspective of "governance" for example, allocation of application security budget might represent an opportunity to move on from compliance to risk mitigation. Sites that carry out payment transactions with credit cards at the level of "merchant" for example, are subject to compliance with the PCI-DSS (Ref [4]). PCI-DSS has provisions for the development and maintenance of secure systems and applications (requirement # 6), for testing security systems and processes (requirement # 11) and for the test of web application for common vulnerabilities (requirement 11.3.2) such as the OWASP Top Ten (Ref [5]). The need of compliance with the PCI-DSS requirements can be a reason to justify an additional investment in technology and services for security testing: examples include source code security reviews with SAST (Static Analysis Security Tests) assessment/tools and application security reviews with DAST (Dynamic Analysis Security Tests) assessments/tools. Another important factor for the “where” is to adopt the “executive perspective” in IT investment for technology.
Today, C-level company executives seldom follow the recommendations of the trusted analyst sources such as Gartner and Forrester when making investments in application security technology. Gartner (Ref[6]) for example, few years ago predicted that investment in firewalls, IDS, VPN and access controls were no longer sufficient to protect applications and that these required separate and specific security measures in particular security testing for vulnerabilities and the integration of security processes with the software development lifecycle (SDLC). This prompted several organizations including banks today to invest in SAST and DAST processes and tools (cite OWASP survey question on which activities are being rolled out)
From the perspective of the “how much need to be spent in application security”, C-level company executives today might need to know how much, of the overall security budget should be spent to make sure a security breach that hit the company won’t happen again. For example, assume the online banking site become a victim of an exploit of a SQL injection vulnerability the question is, specifically how much money should be spent in SQL injection countermeasures to prevent this incident to happen again. To answer these questions, some application security investments criteria needs to be adopted, so that for example, budget allocated for application security can effectively mitigate malware and banking threats and prevent similar incidents and application vulnerability exploits such as SQL injection to occur.
Application security investment criteria can only be useful if are based upon objective and not subjective considerations such as using quantitative evaluations of the costs that the organization incurred because of security breaches exploiting web application vulnerabilities. These criteria must be able to work out the security costs in terms of potential losses due to accidents and attacks and compare it with the cost of the investment in the security of web and mobile applications.
An increase in application security spending can be triggered by the fact of the organization being victimized because of a security incident (use survey again), this shifts executive management perception of risk. The problem is that when CISOs need to decide how much money to spend in application security the approach mostly followed is to apply common sense based upon perception of risk. In the case of a possible loss for data breach incident, let’s say of $ 10 million for example, spending for application security to cover 100% of the costs of the data breach is not always justifiable. The question therefore is still how much should be spent, if not 100% it is the 50%, 25% or 10% or my possible monetary losses? In addition, if allocating a budget of 25% of the estimated potential losses due to data breaches is justifiable, how much of this 25% should be allocated in secure software development/engineering or application security testing for vulnerabilities?We can try to answer these questions by adopting the following criteria for application security budget allocation:
- Estimate of the impact of the costs incurred in the event of an security incident
- Quantitative risk calculation of the annual cost for losses due to a security incident
- Optimization of the security costs in relation to cost of incidents and cost of security measures
- The Return of Security Investment (ROSI)
To obtain an estimate of the impact of the costs incurred in the event of a security incident, the key factor is the ability of ascertain the costs incurred due to the security incident such as the costs of the loss of company data due to an hacking and malware attack. In the case of a security incident that caused a loss of sensitive customer data such as personal identifiable information, debit and credit card data, the costs incurred by the bank include several operational costs. These are the costs for changing account numbers, remission costs for issuance of new credit and debit cards, liability costs because of fraud committed by the fraudster using the stolen data such as for illicit payment transactions and withdraw of money from ATMs. Often times, the determination of such “failure” costs is not directly quantifiable by an organization, such as when this is not a case of a possible monetary loss because of a data breach. In this case, it is possible for the CISO to rely on statistical data on reported data loss incidents as well as on web attacks and vulnerability exploits to determine the possible liability costs to the company in case of data loss incident. By using reported statistical data from data loss incidents, it is possible to estimate the costs incurred by companies to repair the damage caused by security incident that resulted in losses of customer sensitive data or identity loss.
According to (Ref[8]) one of the possible ways to make a risk management decision on whether to mitigate a potential loss is the determine if the company will be legally liable for that data loss. By using the definition of legal liability from a U.S. liability case law, given as Probability (P) of the loss, (L) the amount of the Loss, then there is liability whenever the cost of adequate precautions or the Burden (B) to the company is:
B < P x L
By applying this formula to 2003 data from the the Federal Trade Commission (FTC) for example (Ref[7]), the probability of the loss is 4.6% as the amount of the population that suffered identity fraud while the amount of the loss x victim can be calculated by factoring how much money was spent to recover from the loss considering the time spent was 300 million hours at the hourly wages of $ 5.25/hr plus out of pocket expenses of $ 5 billion:
L = [Time Spent x Recover From Loss x Hourly Wage + Out Of Pocket Expenses]/Number of Victims
With this formula for calculating the amount of loss due to an identity fraud incident, based upon 2003 FTC data, the loss per customer/victim is approximately $ 655 dollars and the burden imposed to the company is $ 30.11 per customer/victim per incident.
The risk management decision is then to decide to whether it is possible to protect a customer for $ 30.11 per customer per annum. If it is, according to (Ref[8]) then liability is found and there is liability risk for the company. This calculation can be useful to determine the potential liability risk in case of data loss incidents, for example by applying the FTC figures to the TJX Inc. incident of 2007 where it was initially announced the exposure of confidential information of 45,700,000 customers, the exposure to the incident for the victims involved could be calculated as:
Cost exposure to the incident = Number of victims exposed by the incident x loss per victim
With this formula using TJX Inc data or number of victims affected and by applying the loss per victim using FTC data, the cost of the incident that represents the loss potential is $ 30 Billion. By factoring this with the probability of the incident occurring, then it is possible to determine how much money should be spend in security measures. In the case of TJX Inc incident for example, assuming a 1 in 1000 chance of occurrence a $ 30 Million security program for TJX Inc would have been justifiable.
One of the challenges of the calculation of the burden to the company because of a potential data loss is to get an accurate estimate of the amount of the loss/victim and the probability of such loss. Regarding the monetary loss per victim exact figures vary depending on the factors that are considered to calculate them.
Statistical data about reported data loss incidents can be used for real case estimates of likelihood or probability of incident targeted a web site: according to public sources of reported data breaches such as dataloss.db (Ref [9]) for example, the percentage of 2010 data loss incidents that reported an attack against web interface is 9%.
In order to estimate the probability of an attack against a web site will cause a data loss by exploiting a specific application vulnerability requires correlation of different type of incidents (e.g. data loss, denial of service, defacement etc) with monitored attacks seeking to exploit specific web application vulnerabilities.
To estimate the probability of a specifc web application vulnerability exploit, we can refer to data reports from the Web Hacking Incident Database (WHID) (Ref [10]). The WHID is a Web Application Security Consortium (WASC) project to provide statistical analysis information of web application security incidents collected from public sources. in 2010 WHID categorized 222 incidents and observed that 33% of the incidents aimed to take down web sites (e.g. with Denial of Service), 15% aimed to deface web sites and 13% to steal information. Among the overall type of attacks the ones that sought to exploit application vulnerabilities such as SQL injection were 21%.
By using 2010 WHID data of reported incident and analysis, the overall probability of an attack aimed to steal information tried to exploit SQL injection vulnerability is therefore 13 % x 21 % = 2.7%. Since SQL injection was also reported to be used for defacement, this ought to be considered as rough estimate.
In another survey of malicuous web attack traffic over a period of six months, December 2010 through May 2011 from the security company Imperva (Ref[11]), SQL injection was observed to be used in 23% of the attacks as third most prevalent after cross site scripting (36 percent) and directory traversal (37 percent) as the most prevalent.
By comparing WHID and Imperva web attack surveys, an order of magnitude of 20% for attacks exploting SQL injection vulnerability seems an acceptable rough estimate.
By assuming the the data loss of security incident is $ 655/victim, and that the probability that such incident exploits a SQL injection vulnerability is 2.7%, the liability for a company's web site that serves say one million of registered customers is thus $ 17,685,000 or $ 17 x victim.
Assuming that I will spend as much in security measures, this is the maximum amount estimated for expenses in security measures to thwart SQL injection attacks that includes acquisition of technology for secure software development, documentation, standards, processes, tools as well costs for the recruitment of qualified personnel and secure coding training expecially for web developers. Normally this dollar figure ought to be considered a maximum value since assumes a total loss of the customer data.
It is important to notice that SQL injection exploits herein is being referenced as an example of a top 1 OWASP (Ref [5]) (2010 A1-Injection) most critical web application security risks for opportunistic exploits. OWASP rates SQL injection vulnerability technical impact as severe since "can result in data loss or corruption, lack of accountability, or denial of access and..sometimes lead to complete host takeover". The business impact that we calculated as liability for a medium size company based upon a value of the asset of 655 $/user assumes that this value can be stolen, modified or deleted to cause both tangible harm to the company (e.g. money loss) as well as intangible harm (e.g. reputaton damage).
Besides calculation of liability costs, quantitative risk analysis can be used to estimate the spending for application security measures on the yearly basis such as by calculating the impact of a security incident on an annual basis. Quantitative risks can be calculated by the assessment of the Single Loss Expectancy (SLE) or probability of a loss as a result of a security incident and the Annual Rate of Occurrence (ARO) or the annual frequency of the security incident. By using quantitative risk analysis, CISOs can estimate the amount that a given organization managing a web application should spend on application security measures to mitigate the risk of a data loss due to the exploitation of an application vulnerability.
The SLE can be calculated with the following formula:
SLE = AV x EF
Where, AV is the Asset Value (AV) and EF is the Exposure Factor (EF). The EF represents the percentage of the asset loss because of the realization of a threat or an incident. In the case of the FTC data this represents the amount of the population that suffered identity fraud and is 4.6%
Assuming the AV of 1 million accounts of $ 655,000,000 and an exposure factor of 4.6 % the SLE is $ 30,130,000 Assuming a frequency of 2 attacks every ten years or 1 attack every 5 years such as in the case of TJX Inc the ARO is 20% hence the estimated annual loss or Annual Loss Expectancy (ALE) can be calculated using the formula :
ALE = ARO x SLO
The calculated Annual Loss Expectancy (ALE) for data loss incident is therefore $ 6,026,000/year [Add here comparison with average cost of incident to company from Ponemon institure/Arcsight survey] [Add here that TJX Incident was caused by SQL injection attack] [Add here that Verizon study points to at least 50 % of attacks were the result of hacking and that high profile breaches including PBS, Sony Epsilon were result of web application attacks]
Now the question is if using quantitative risk analysis leads to an estimate to the optimal investment for application security measures. The honest answer is, not necessarily. The correct answer is to use cost vs. benefit analysis to determine the optimal value. By comparing the costs of security incidents against the cost of security measures it is possible to determine when this maximizes the benefit, that is, the overall security of the application. In case of software security costs for example, the cost due to software security failures including security incidents decrease as the company spends more money in security measures as shown in (FIG 1). The optimal investment in the security measures is the one that maximizes the security of the application and minimizes both the cost of security measures and of the cost incurred because of security incidents. According to an analytical study of costs vs. benefits of security (Ref [12]) the optimal investment is when the cost of security measures is approximately 37% of the estimated losses. For our example, assuming the total estimated losses of $ 6,026,000/year due to data loss incidents, the optimal expense for security measures, using this empirical value from the study, is $ 2,229,620/year.
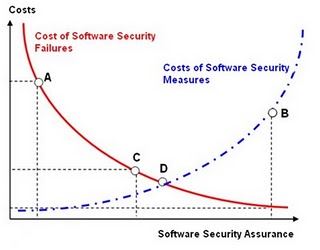
Figure 1: Cost of Investment in software security measures against failure costs due to incidents that exploit software vulnerabilities. At the point (A) to the costs due to software security failures exceed of several order of magnitude the expenditure in countermeasures and the assurance on the security of the software is very low, on the contrary in (B) the costs of security measures outweigh the costs due to the software failures, the software can be considered very secure but too much money is spent for software security assurance. In point (C) the cost of losses is nearly two times larger costs of security measures while in point (D) the costs due to incidents is equal to the cost of the security measures. The optimal value for spending of security measures is the one that minimizes both the cost of incidents and security measures and maximizes the benefit or the security of the software.

Finally, it is important to determine the most efficient way to spend the application security budget from a perspective of this being an investment. If the CISO considers application security spending as an investment rather than an expense, for example, the budget can be justifiable as additional savings the company gets because of the investment in security. The factor to calculate the savings in terms of investment in security is the Return of Security Investment (ROSI). The ROSI can also help to determine if the investment in countermeasures to thwart hacking and malware attacks is justifiable: if the ROSI is not positive, the investment is not justifiable while if it is null, it does not yield any savings or investment returns.
There are several empirical formulas to calculate ROSI; one is to factor of the savings for the data losses avoided over the total cost of the countermeasures. Assuming the Total Cost of Ownership (TCO) (Ref [13]) for the cost of countermeasure is $ 2,229,620 (previously calculated as optimal value of expense in countermeasures for SQL injection) that include development costs of acquisition of the new technologies, processes, tools as well as operating and maintenance costs it is possible to calculate the savings. ROSI can be calculated using the following empirical formula (Ref[14]):
ROSI= [(ALE x % of effective risk mitigation) - cost of countermeasures]/cost of countermeasures
With this ROSI formula, assuming that the ALE for SQL injection is $ 6,026,000 and that the effectiveness of the mitigation is 75% (assume for example, a SQL injection mitigation at different layers that includes use of prepared statements/store procedures in source code as well as filtering of malicious SQL characters at the web server and application server), the cost of countermeasure is $ 2,229,620, the ROSI to the company because of fixing SQL injection vulnerabilities before waiting of a security incident to exploit such vulnerability, is 102% per year. Since there is return of investment, the spending in countermeassures is worth it and will make the company save money. The best use of ROSI (Ref[14]) is to compare alternative investments in security countermeasures such as to decide whether to invest in the development of a new countermeasure or extending the capabilities of an existing one.
As a comparative measurementfor example, ROSI can be used by CISOs to determine which software security is more efficient or yields the organization the higher savings and returns on the investment. According to research of Soo Hoo (IBM) (Ref [15]) on ROSI of the various activities of software security in software development cycle, the maximum return of investment (21%) or a savings of $ 210,000 on an investment of a $ 1 Million Secure Software Development Lifecycle (S-SDLC) program for example is obtained when the investment is in activities that aim to identify and remedy security defects during the design phase such as threat modeling. The return of investment is 15% when the defects are identified and remedied during implementation (code) such as with source code analysis and of only 12% when these are identified and remedied during the testing-validation phase such as with ethical hacking/pen tests. The best investment in application security is therefore in activities that aim to identify defects as early as during the design phase of the SDLC, in essence, the more CISOs think about investing in software security engineering programs expecially threat modeling, the more they'll save on the costs of implementing and fixing security issues later in the SDLC such as during the validation phase or when the application is already in production in response to security incidents.
Finally, it is important to notice that the criteria dealt with herein are based upon empirical formulas and are as good as the data used. Nevertheless,when used consistently and with accurate data and validated assumptions, these can be used by information risk management decision makers to decide if the investment in application security is financially justifiable. As security as to make business sense these criteria can also be used to make the business case for spending in application security. It is common sense not to spend more in application security if the cost is greater than the risk exposure but to made financial investments based upon informed risk decisions, before spending in security, it is important to adopt risk-cost criteria so that objective and non subjective considerations can be made.
References
Ref [1]: Verizon 2011 Data Breach Investigation Report http://www.verizonbusiness.com/resources/reports/rp_data-breach-investigations-report-2011_en_xg.pdf
Ref [2]: US Q2 2011 GDP Report Is Bad News for the US Tech Sector, But With Some Silver Linings http://blogs.forrester.com/andrew_bartels/11-07-29-us_q2_2011_gdp_report_is_bad_news_for_the_us_tech_sector_but_with_some_silver_linings
Ref [3]: Supplement to Authentication in an Internet banking Environment http://www.fdic.gov/news/news/press/2011/pr11111a.pdf
Ref [4] PCI-DSS: https://www.pcisecuritystandards.org/security_standards/index.php
Ref [5] OWASP Top Ten: https://www.owasp.org/index.php/Category:OWASP_Top_Ten_Project
Ref [6] Gartner teleconference on application security, Joseph Feiman, VP and Gartner Fellow http://www.gartner.com/it/content/760400/760421/ks_sd_oct.pdf
Ref [7] Identity Theft Survey Report, Federal Trade Commission,September, 2003, http://www.ftc.gov/os/2003/09/synovatereport.pdf
Ref [8] Dan E Geer Economics and Strategies of Data Security http://www.verdasys.com/thoughtleadership/
Ref [9] Data Loss Database http://datalossdb.org/
Ref [10] WHID, Web Hacking Incident Database http://projects.webappsec.org/w/page/13246995/Web-Hacking-Incident-Database
Ref[11] Imperva's Web Application Attack Report http://www.imperva.com/docs/HII_Web_Application_Attack_Report_Ed1.pdf
Ref [12] Gordon, L.A. and Loeb, M.P. “The economics of information security investment”, ACM Transactions on Information and Systems Security, Vol.5, No.4, pp.438-457, 2002.
Ref [13] Total Cost of Ownership http://en.wikipedia.org/wiki/Total_cost_of_ownership
Ref [14] Wes SonnenReich, Return of Security Investment, Practical Quantitative Model http://www.infosecwriters.com/text_resources/pdf/ROSI-Practical_Model.pdf
Ref [15] Tangible ROI through Secure Software Engineering http://www.mudynamics.com/assets/files/Tangible%20ROI%20Secure%20SW%20Engineering.pdf
This article is a stub. You can help OWASP by expanding it or discussing it on its Talk page.