This site is the archived OWASP Foundation Wiki and is no longer accepting Account Requests.
To view the new OWASP Foundation website, please visit https://owasp.org
Difference between revisions of "Testing for AJAX (OWASP-AJ-002)"
(→References) |
(→Black Box testing and example) |
||
| (10 intermediate revisions by 5 users not shown) | |||
| Line 1: | Line 1: | ||
| − | + | {{Template:OWASP Testing Guide v3}} | |
| − | {{Template:OWASP Testing Guide | ||
== Brief Summary == | == Brief Summary == | ||
| − | |||
Because most attacks against AJAX applications are analogs of attacks against traditional web applications, testers should refer to other sections of the testing guide to look for specific parameter manipulations to use in order to discover vulnerabilities. The challenge with AJAX-enabled applications is often finding the endpoints that are the targets for the asynchronous calls and then determining the proper format for requests. | Because most attacks against AJAX applications are analogs of attacks against traditional web applications, testers should refer to other sections of the testing guide to look for specific parameter manipulations to use in order to discover vulnerabilities. The challenge with AJAX-enabled applications is often finding the endpoints that are the targets for the asynchronous calls and then determining the proper format for requests. | ||
| − | |||
== Description of the Issue == | == Description of the Issue == | ||
| − | |||
Traditional web applications are fairly easy to discover in an automated fashion. An application typically has one or more pages that are connected by HREFs or other links. Interesting pages will have one or more HTML FORMs. These forms will have one or more parameters. By using simple spidering techniques such as looking for anchor (A) tags and HTML FORMs it should be possible to discover all pages, forms, and parameters in a traditional web application. Requests made to this application follow a well-known and consistent format laid out in the HTTP specification. GET requests have the format: | Traditional web applications are fairly easy to discover in an automated fashion. An application typically has one or more pages that are connected by HREFs or other links. Interesting pages will have one or more HTML FORMs. These forms will have one or more parameters. By using simple spidering techniques such as looking for anchor (A) tags and HTML FORMs it should be possible to discover all pages, forms, and parameters in a traditional web application. Requests made to this application follow a well-known and consistent format laid out in the HTTP specification. GET requests have the format: | ||
| Line 22: | Line 18: | ||
Unfortunately, server-side AJAX endpoints are not as easy or consistent to discover, and the format of actual valid requests is left to the AJAX framework in use or the discretion of the developer. Therefore to fully test AJAX-enabled applications, testers need to be aware of the frameworks in use, the AJAX endpoints that are available, and the required format for requests to be considered valid. Once this understanding has been developed, standard parameter manipulation techniques using a proxy can be used to test for SQL injection and other flaws. | Unfortunately, server-side AJAX endpoints are not as easy or consistent to discover, and the format of actual valid requests is left to the AJAX framework in use or the discretion of the developer. Therefore to fully test AJAX-enabled applications, testers need to be aware of the frameworks in use, the AJAX endpoints that are available, and the required format for requests to be considered valid. Once this understanding has been developed, standard parameter manipulation techniques using a proxy can be used to test for SQL injection and other flaws. | ||
| − | |||
== Black Box testing and example == | == Black Box testing and example == | ||
'''Testing for AJAX Endpoints:''' <br> | '''Testing for AJAX Endpoints:''' <br> | ||
| − | Before an AJAX-enabled web application can be tested, the call endpoints for the asynchronous calls must be enumerated. See [[Application_Discovery_AoC]] for more information about how traditional web applications are discovered. For AJAX applications, there are two main approaches to | + | Before an AJAX-enabled web application can be tested, the call endpoints for the asynchronous calls must be enumerated. See [[Application_Discovery_AoC]] for more information about how traditional web applications are discovered. For AJAX applications, there are two main approaches to determine call endpoints: parsing the HTML and JavaScript files and using a proxy to observe traffic. |
The advantage of parsing the HTML and JavaScript files in a web application is that it can provide a more comprehensive view of the server-side capabilities that can be accessed from the client side. The drawback is that manually reviewing HTML and JavaScript content is tedious and, more importantly, the location and format of server-side URLs available to be accessed by AJAX calls are framework dependent. | The advantage of parsing the HTML and JavaScript files in a web application is that it can provide a more comprehensive view of the server-side capabilities that can be accessed from the client side. The drawback is that manually reviewing HTML and JavaScript content is tedious and, more importantly, the location and format of server-side URLs available to be accessed by AJAX calls are framework dependent. | ||
| Line 46: | Line 41: | ||
By enumerating the AJAX endpoints available in an application and determining the required request format, the tester can set the stage for further analysis of the application. Once endpoints and proper request formats have been determined, the tester can use a web proxy and standard web application parameter manipulation techniques to look for SQL injection and parameter tampering attacks.<br><br> | By enumerating the AJAX endpoints available in an application and determining the required request format, the tester can set the stage for further analysis of the application. Once endpoints and proper request formats have been determined, the tester can use a web proxy and standard web application parameter manipulation techniques to look for SQL injection and parameter tampering attacks.<br><br> | ||
| − | '''Intercepting and debugging | + | '''Intercepting and debugging JS code with Browsers''' |
| − | + | Using normal browsers, it's possible to analyze in detail JavaScript-based web applications. <br> | |
| − | analyze | + | Ajax calls in Firefox can be intercepted by using extension plugins that monitor the code flow. <br> |
| − | Ajax calls in | + | Two extensions providing this ability are "FireBug" and "Venkman JavaScript Debugger". |
| − | extension plugins that monitor the code flow. <br> | ||
| − | Two extensions providing this ability are "FireBug" and | ||
| − | "Venkman JavaScript Debugger". | ||
| − | For Internet Explorer are | + | For Internet Explorer, there are some tools provided by Microsoft, such as "Script Debugger", that permits real-time JavaScript debugging. |
| − | provided by Microsoft | ||
| − | that permits real-time | ||
| − | By using | + | By using FireBug on a page, a tester could find Ajax endpoints by setting "Options->Show XmlHttpRequest". |
| − | by setting "Options->Show XmlHttpRequest". | ||
[[Image:Firebug1.jpg]] | [[Image:Firebug1.jpg]] | ||
| − | From now on, any request accomplished by XMLHttpRequest object will be listed on the bottom of | + | From now on, any request accomplished by the XMLHttpRequest object will be listed on the bottom of the browser.<br> |
| − | the browser.<br> | ||
| − | On the right of the | + | On the right of where the URL is displayed, the source code and line number from where the call was made are shown. And by clicking on the displayed URL, |
| − | where the call was | + | server response is also shown.<br> |
| − | server response is shown.<br> | + | So, it's straightforward to understand what the request and response are and where the endpoint is. <br> |
| − | So it's straightforward to understand | + | If the link to a source script is clicked, the tester will find where the request originates. |
| − | |||
| − | If the link to source script is clicked, the tester | ||
[[Image:Firebug_2.jpg]] | [[Image:Firebug_2.jpg]] | ||
| − | As debugging Javascript is the way to learn how scripts build | + | As debugging Javascript is the way to learn how scripts build URLs, and how many parameters are available, by filling the form when the password is written down and the related input tag loses its focus, a new request is accomplished as could be seen on the following screenshot. |
| − | |||
[[Image:Firebug_3.jpg]] | [[Image:Firebug_3.jpg]] | ||
| − | Now, by clicking on the link to | + | Now, by clicking on the link to JavaScript source code, the tester has access to the next endpoint. |
| − | |||
[[Image:Firebug_4.jpg]] | [[Image:Firebug_4.jpg]] | ||
| − | Then by setting breakpoints on some lines near the | + | Then by setting breakpoints on some lines near the JavaScript endpoint, it's easy to know the call stack as shown in the next screenshot. |
| Line 94: | Line 78: | ||
== Gray Box testing and example == | == Gray Box testing and example == | ||
'''Testing for AJAX Endpoints:'''<br> | '''Testing for AJAX Endpoints:'''<br> | ||
| − | Access to additional information about the application source code can greatly speed efforts to enumerate AJAX endpoints, and the knowledge of what frameworks are in use will help the tester to understand the required format for AJAX requests. | + | Access to additional information about the application source code can greatly speed up efforts to enumerate AJAX endpoints, and the knowledge of what frameworks are in use will help the tester to understand the required format for AJAX requests. |
<br> | <br> | ||
'''Result Expected:'''<br> | '''Result Expected:'''<br> | ||
| − | Knowledge of the frameworks being used and AJAX endpoints that are available | + | Knowledge of the frameworks being used and AJAX endpoints that are available help the tester to focus his efforts and reduce the time required for discovering and application footprinting.<br><br> |
== References == | == References == | ||
'''OWASP''' | '''OWASP''' | ||
| − | * [[ | + | * OWASP AJAX Security Project[[Category:OWASP_AJAX_Security_Project]] |
'''Whitepapers'''<br> | '''Whitepapers'''<br> | ||
* [http://www.securityfocus.com/infocus/1879 Hacking Web 2.0 Applications with Firefox], Shreeraj Shah | * [http://www.securityfocus.com/infocus/1879 Hacking Web 2.0 Applications with Firefox], Shreeraj Shah | ||
| Line 107: | Line 91: | ||
'''Tools'''<br> | '''Tools'''<br> | ||
* The OWASP Sprajax tool [[Category:OWASP_Sprajax_Project]] can be used to spider web applications, identify AJAX frameworks in use, enumerate AJAX call endpoints, and fuzz those endpoints with framework-appropriate traffic. At the current time, there is only support for the Microsoft Atlas framework (and detection for the Google Web Toolkit), but ongoing development should increase the utility of the tool. | * The OWASP Sprajax tool [[Category:OWASP_Sprajax_Project]] can be used to spider web applications, identify AJAX frameworks in use, enumerate AJAX call endpoints, and fuzz those endpoints with framework-appropriate traffic. At the current time, there is only support for the Microsoft Atlas framework (and detection for the Google Web Toolkit), but ongoing development should increase the utility of the tool. | ||
| − | * '''Venkman''' <br> [http://www.mozilla.org/projects/venkman/ Venkman]is the code name for Mozilla's JavaScript Debugger. Venkman aims to provide a powerful JavaScript debugging environment for Mozilla based browsers. | + | * '''Venkman''' <br> [http://www.mozilla.org/projects/venkman/ Venkman] is the code name for Mozilla's JavaScript Debugger. Venkman aims to provide a powerful JavaScript debugging environment for Mozilla-based browsers. |
| − | * ''' Ghost Train'''<br>[http://wiki.script.aculo.us/scriptaculous/show/GhostTrain Scriptaculous's Ghost Train] is a tool to ease the development of functional tests for web sites. It’s | + | * ''' Ghost Train''' <br> [http://wiki.script.aculo.us/scriptaculous/show/GhostTrain Scriptaculous's Ghost Train] is a tool to ease the development of functional tests for web sites. It’s an event recorder, and a test-generating and replaying add-on you can use with any web application. |
| − | * '''Squish/Web (froglogic)''' | + | * '''Squish/Web (froglogic)''' <br> [http://www.froglogic.com/squish Squish] is an automated, functional testing tool. It allows you to record, edit, and run web tests in different browsers (IE, Firefox, Safari, Konqueror, etc.) on different platforms without having to modify the test scripts. It supports different scripting languages for tests. |
| − | [http://www.froglogic.com/squish Squish] is an automated, functional testing tool. It allows you to record, edit, and run web tests in different browsers (IE, Firefox, Safari, Konqueror, etc.) on different platforms without having to modify the test scripts. | + | * '''SWExplorerAutomation (SWEA)''' <br> [http://www.webiussoft.com SWEA] automates regression and functional testing for Web applications. SWEA records, replays test scripts and generates C# or VB.NET script code. SWEA generated scripts can be used in NUnit, MbUnit or VS Unit testing frameworks. SWEA was specially designed to automate complex DHTML/AJAX applications. |
| − | * '''JsUnit'''<br>[http://www.edwardh.com/jsunit/ JsUnit] is a Unit Testing framework for client-side (in-browser) JavaScript. It is essentially a port of JUnit to JavaScript. | + | * '''JsUnit''' <br> [http://www.edwardh.com/jsunit/ JsUnit] is a Unit Testing framework for client-side (in-browser) JavaScript. It is essentially a port of JUnit to JavaScript. |
| − | * '''Firebug'''<br>[https://addons.mozilla.org/firefox/1843/ FireBug] lets you explore the far corners of the DOM by keyboard or mouse. All of the tools you need to poke, prod, and monitor your JavaScript, CSS, HTML and Ajax are brought together into one seamless experience, including a debugger, an error console, command line, and a variety of fun inspectors. | + | * '''Firebug''' <br> [https://addons.mozilla.org/firefox/1843/ FireBug] lets you explore the far corners of the DOM by keyboard or mouse. All of the tools you need to poke, prod, and monitor your JavaScript, CSS, HTML and Ajax are brought together into one seamless experience, including a debugger, an error console, command line, and a variety of fun inspectors. |
| − | |||
| − | |||
Latest revision as of 02:06, 10 February 2009
OWASP Testing Guide v3 Table of Contents
This article is part of the OWASP Testing Guide v3. The entire OWASP Testing Guide v3 can be downloaded here.
OWASP at the moment is working at the OWASP Testing Guide v4: you can browse the Guide here
Brief Summary
Because most attacks against AJAX applications are analogs of attacks against traditional web applications, testers should refer to other sections of the testing guide to look for specific parameter manipulations to use in order to discover vulnerabilities. The challenge with AJAX-enabled applications is often finding the endpoints that are the targets for the asynchronous calls and then determining the proper format for requests.
Description of the Issue
Traditional web applications are fairly easy to discover in an automated fashion. An application typically has one or more pages that are connected by HREFs or other links. Interesting pages will have one or more HTML FORMs. These forms will have one or more parameters. By using simple spidering techniques such as looking for anchor (A) tags and HTML FORMs it should be possible to discover all pages, forms, and parameters in a traditional web application. Requests made to this application follow a well-known and consistent format laid out in the HTTP specification. GET requests have the format:
http://server.com/directory/resource.cgi?param1=value1&key=value
POST requests are sent to URLs in a similar fashion:
http://server.com/directory/resource.cgi
Data sent to POST requests is encoded in a similar format and included in the request after the headers:
param1=value1&key=value
Unfortunately, server-side AJAX endpoints are not as easy or consistent to discover, and the format of actual valid requests is left to the AJAX framework in use or the discretion of the developer. Therefore to fully test AJAX-enabled applications, testers need to be aware of the frameworks in use, the AJAX endpoints that are available, and the required format for requests to be considered valid. Once this understanding has been developed, standard parameter manipulation techniques using a proxy can be used to test for SQL injection and other flaws.
Black Box testing and example
Testing for AJAX Endpoints:
Before an AJAX-enabled web application can be tested, the call endpoints for the asynchronous calls must be enumerated. See Application_Discovery_AoC for more information about how traditional web applications are discovered. For AJAX applications, there are two main approaches to determine call endpoints: parsing the HTML and JavaScript files and using a proxy to observe traffic.
The advantage of parsing the HTML and JavaScript files in a web application is that it can provide a more comprehensive view of the server-side capabilities that can be accessed from the client side. The drawback is that manually reviewing HTML and JavaScript content is tedious and, more importantly, the location and format of server-side URLs available to be accessed by AJAX calls are framework dependent.
The tester should look through HTML and JavaScript files to find URLs of additional application surface exposure. Searching for use of the XMLHttpRequest object in JavaScript code can help to focus these reviewing efforts. Also, by knowing the names of included JavaScript files, the tester can determine which AJAX frameworks appear to be in use. Once AJAX endpoints have been identified, the tester should further inspect the code to determine the format required of requests.
The advantage of using a proxy to observe traffic is that the actual requests demonstrate conclusively where the application is sending requests and what format those requests are in. The disadvantage is that only the endpoints that the application actually makes calls to will be revealed. The tester must fully exercise the remote application, and even then there could be additional call endpoints that are available but not actively in use. In exercising the application, the proxy should observe traffic to both the user-viewable pages and the background asynchronous traffic to the AJAX endpoints. Capturing this session traffic data allows the tester to determine all of the HTTP requests that are being made during the session as opposed to only looking at the user-viewable pages in the application.
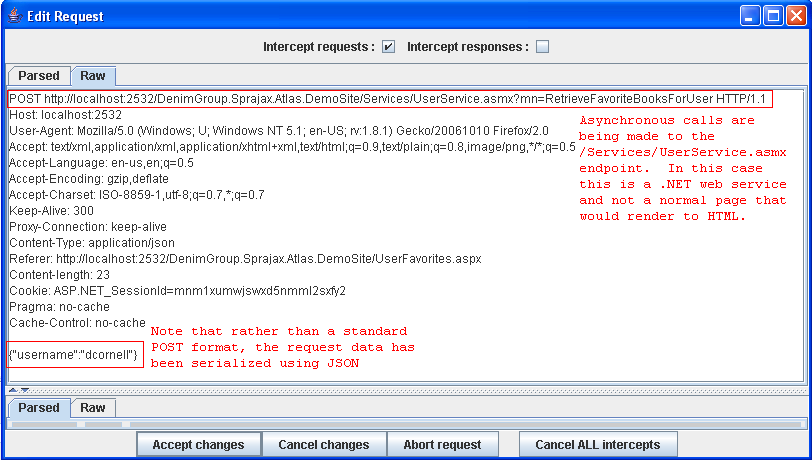
Result Expected:
By enumerating the AJAX endpoints available in an application and determining the required request format, the tester can set the stage for further analysis of the application. Once endpoints and proper request formats have been determined, the tester can use a web proxy and standard web application parameter manipulation techniques to look for SQL injection and parameter tampering attacks.
Intercepting and debugging JS code with Browsers
Using normal browsers, it's possible to analyze in detail JavaScript-based web applications.
Ajax calls in Firefox can be intercepted by using extension plugins that monitor the code flow.
Two extensions providing this ability are "FireBug" and "Venkman JavaScript Debugger".
For Internet Explorer, there are some tools provided by Microsoft, such as "Script Debugger", that permits real-time JavaScript debugging.
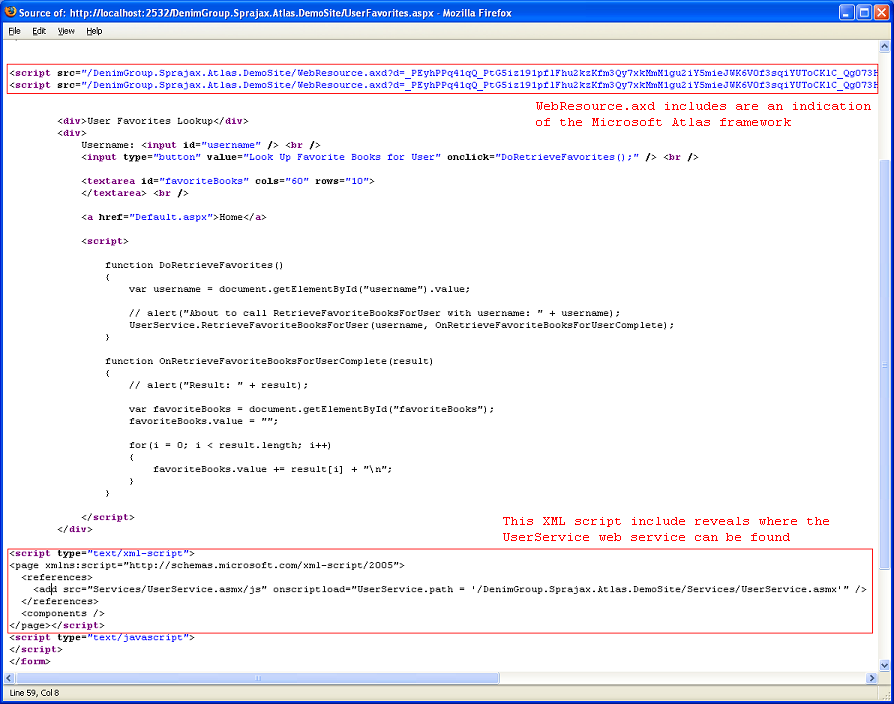
By using FireBug on a page, a tester could find Ajax endpoints by setting "Options->Show XmlHttpRequest".
From now on, any request accomplished by the XMLHttpRequest object will be listed on the bottom of the browser.
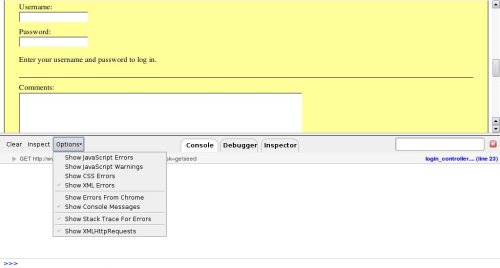
On the right of where the URL is displayed, the source code and line number from where the call was made are shown. And by clicking on the displayed URL,
server response is also shown.
So, it's straightforward to understand what the request and response are and where the endpoint is.
If the link to a source script is clicked, the tester will find where the request originates.
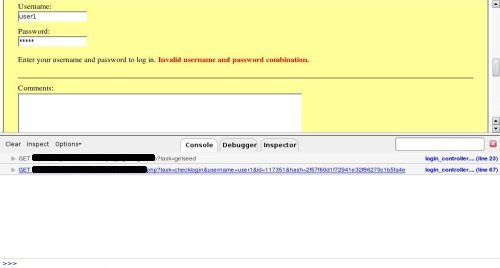
As debugging Javascript is the way to learn how scripts build URLs, and how many parameters are available, by filling the form when the password is written down and the related input tag loses its focus, a new request is accomplished as could be seen on the following screenshot.
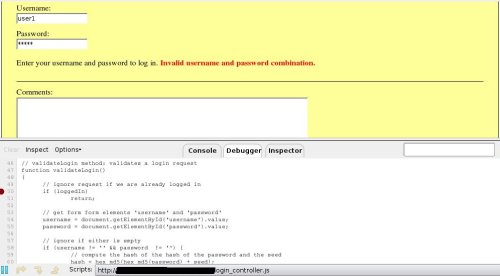
Now, by clicking on the link to JavaScript source code, the tester has access to the next endpoint.
Then by setting breakpoints on some lines near the JavaScript endpoint, it's easy to know the call stack as shown in the next screenshot.
Gray Box testing and example
Testing for AJAX Endpoints:
Access to additional information about the application source code can greatly speed up efforts to enumerate AJAX endpoints, and the knowledge of what frameworks are in use will help the tester to understand the required format for AJAX requests.
Result Expected:
Knowledge of the frameworks being used and AJAX endpoints that are available help the tester to focus his efforts and reduce the time required for discovering and application footprinting.
References
OWASP
- OWASP AJAX Security Project
Whitepapers
- Hacking Web 2.0 Applications with Firefox, Shreeraj Shah
- Vulnerability Scanning Web 2.0 Client-Side Components, Shreeraj Shah
Tools
- The OWASP Sprajax tool can be used to spider web applications, identify AJAX frameworks in use, enumerate AJAX call endpoints, and fuzz those endpoints with framework-appropriate traffic. At the current time, there is only support for the Microsoft Atlas framework (and detection for the Google Web Toolkit), but ongoing development should increase the utility of the tool.
- Venkman
Venkman is the code name for Mozilla's JavaScript Debugger. Venkman aims to provide a powerful JavaScript debugging environment for Mozilla-based browsers. - Ghost Train
Scriptaculous's Ghost Train is a tool to ease the development of functional tests for web sites. It’s an event recorder, and a test-generating and replaying add-on you can use with any web application. - Squish/Web (froglogic)
Squish is an automated, functional testing tool. It allows you to record, edit, and run web tests in different browsers (IE, Firefox, Safari, Konqueror, etc.) on different platforms without having to modify the test scripts. It supports different scripting languages for tests. - SWExplorerAutomation (SWEA)
SWEA automates regression and functional testing for Web applications. SWEA records, replays test scripts and generates C# or VB.NET script code. SWEA generated scripts can be used in NUnit, MbUnit or VS Unit testing frameworks. SWEA was specially designed to automate complex DHTML/AJAX applications. - JsUnit
JsUnit is a Unit Testing framework for client-side (in-browser) JavaScript. It is essentially a port of JUnit to JavaScript. - Firebug
FireBug lets you explore the far corners of the DOM by keyboard or mouse. All of the tools you need to poke, prod, and monitor your JavaScript, CSS, HTML and Ajax are brought together into one seamless experience, including a debugger, an error console, command line, and a variety of fun inspectors.
