This site is the archived OWASP Foundation Wiki and is no longer accepting Account Requests.
To view the new OWASP Foundation website, please visit https://owasp.org
Conference Profit Sharing Split Rationale
Executive Summary
The current policy as set by the Global Conferences Committee (vote) and the OWASP Board (vote) should remain in effect. OWASP events are the cornerstone of the OWASP Foundation's solvency and provide the necessary funding to enable virtually all of OWASP's activities. In 2010, conference income accounted for 77% of OWASP's annual income and brought in a total profit of $240,399.71 which enabled the foundation to have a net positive income while still funding all of its operational activities as well as projects, chapters, loss-leader events and outreach. The current profit sharing policy with caps is in the best interests of the Foundation as a whole while also recognizing OWASP chapters who host OWASP events, by providing them some share in the profits the OWASP foundation makes from events. Discussions around removing caps will result in significant detriment to the OWASP Foundation's budget (for 2010 loss of $33,011.37 instead of a net gain of $4,972.63) and would concentrate a huge amount of OWASP funds into the hands on a few few chapters, potentially inhibiting OWASP from accomplishing its mission. The current policy is both fair and equitable.
Rationale
In 2010 after the establishment of the membership split between the OWASP Foundation and OWASP chapters questions began to arise regarding a potential split of OWASP event profits with local chapters. Prior to 2011 (with the exception of AppSec EU 2010, which was a pilot case for sharing, and AppSec DC, LASCON and AppSec USA 2010, which received retroactive payments due to some inconsistencies in communication from the OWASP Operations Director) the Conferences Committee was not sharing any conference revenues with the local chapters who hosted the events. The following chart (current as of June 1st 2011) shows the actual distribution of funds to chapters as a result of conference revenues. The AppSec EU 2010 event, which was the pilot for sharing, was governed by the membership split percentage, 60% to the foundation 40% to the local chapter. AppDec DC, LASCON and AppSec USA 2010 were governed by the currently enacted policy.
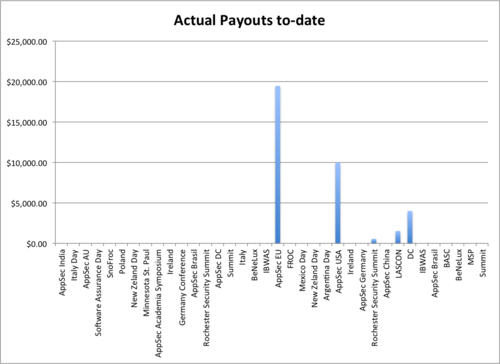
As you can see AppSec EU had a very significant profit for the local chapter. The Conferences Committee took this under advisement when debating its final policy on the matter. Notably, it is the revenue that OWASP makes from conferences that allow the Foundation to fund all aspects of it’s operations, projects, chapters as well as some of our most successful outreach activities such as the 2011 Global Summit. Last year conference income accounted for 77% of OWASP's annual income and brought in a total profit of $240,399.71. To provide some perspective, OWASP's overall net income in 2010 was $4,972.63, so without significant conference revenues the OWASP Foundation would be in a position of significant financial loss and would not have the resources available to fund it’s operations or any other strategic initiatives.
The OWASP Foundation does not make a significant amount of money, yet it still manages to do some very big and important projects/events. 'The heart of the matter here is who within OWASP should be the primary allocator of the limited funds OWASP has, the foundation or chapters. As an example Take the 2011 Global Summit, arguably the most successful Summit OWASP has had and it was funded almost completely by the Foundation. The Summit was a huge success, and arguably everyone in OWASP supported the event; however, the costs for the summit were not as equally shared.
The total cost for the summit was $198,620.74. The OWASP Foundation did not have sufficient funds to cover all the costs of this event, and as a result turned to chapters (and in a very limited way, sponsors) for help in paying the costs to put on the Summit. From the call for assistance to local OWASP chapters, a full 41% of chapters did not even respond to the request (by not responding, they forfeited their entire budgets for a total of $7,999.71), 28% responded but provided $0 funding to assist the effort. In the end only 35 chapters, 29%, decided that they would help support this audacious occasion and provided a total of $10,387.57 to support the overall effort. As a result the OWASP Foundation provided $180,343.46 while chapters provided $18,387.28 (44% of which was forfeiture). It was clear, however, that chapters did think that the Summit was a worthwhile and important event, this was made evident by the $26,068.31 they spent sending members of local chapters to the event. A full 142% more than they were willing to donate to the cause.
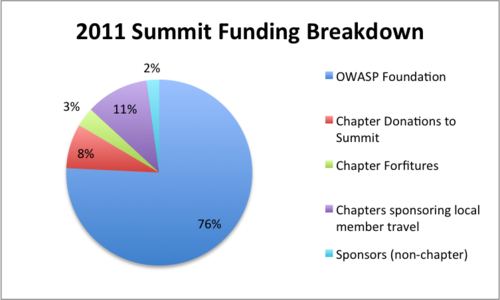
This is not to say that chapters are bad in some way, just that their interests are more local and not as broadly focused as the foundation as a whole. Had the Summit finances been left solely to chapters to provide, there would have been no summit. ‘’’The Foundation Board and the Global Committees are tasked with the stewardship of the foundation as a whole and have a broader interest.’’’ While I agree it’s important to empower chapters and local leaders to make smart decisions and as a result the GCC has provided, for the first time, profit sharing for local chapters I do not believe that we should provide the chapters with too much of the foundation’s overall resources otherwise OWASP will not be able to do some of the bigger things.
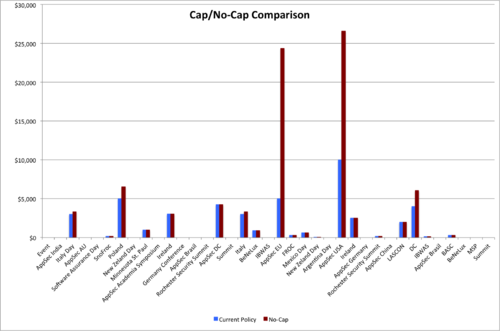
There has been much talk of overturning the current Conferences Committee policy in favor of a policy without any caps. I believe this would create a series of challenges for the OWASP Foundation. First, implementing such a policy would put a significant amount of resources in a few local chapter budgets, potentially starving the foundation. With the current policy in place, profit sharing for 2010 would amount to 5.19% of ALL OWASP INCOME ($25,008.47) for 2010, by eliminating this cap this number jumps to nearly 10% ($62,992.56) putting an additional $37,984 (151.88% increase) into chapter coffers. This is money that can not go to funding that really great project that college student wants to work on, getting Kate and Paulo that much needed raise, expanding OWASP outreach activities at developer conferences or going to our ability to host another Global Summit in 2 years. You might say, well the chapters who receive the benefits can do all that but the majority of this this huge additional profit would be clustered in only 2 chapters (getting an additional $35,976) as illustrated in the graph below.

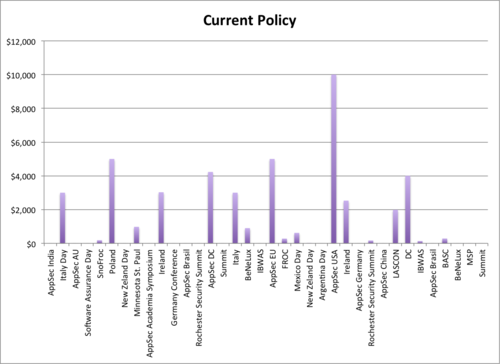
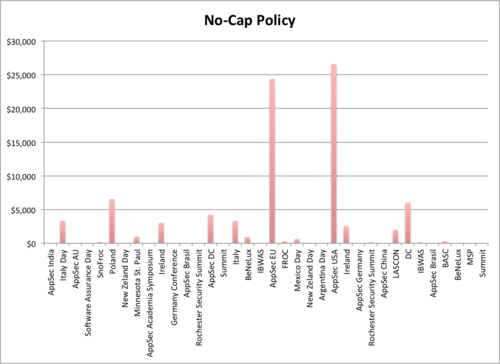
As you can see, the perceived notions that conference profit sharing caps discourage chapters from hosting events is really untrue, all they do is create a more equitable distribution of the profit sharing by eliminating “windfall” incomes for a very few chapters that host Global AppSec events in the US or EU and ensuring that the foundation has the resources it needs to continue the mission. While I recognize that the local chapters do most of the event planning and coordination work it’s important to also remember that the OWASP Foundation takes on all of the financial risk for these events. We are not discussing profit/loss sharing, only profit, all losses are absorbed by the foundation. In fact many events, as demonstrated by the Policy Comparison Worksheet and graph above are loss-leaders and do not make any profits, in fact many do not take in any income. It's the profit that is generated by the other events, managed by the foundation, that allows us to support these outreach activities that are not profitable but strategic in support of the mission. As shown in the chart above, implementing the caps only really impacts a few events annually and ensures we do not create a rich chapter/poor chapter condition inside of OWASP and that the Foundation has the funds it needs to continue its mission.
Resources
Policy Comparison Worksheet (Yellow have no data)